Loading content...
HAVE A QUESTION?
Call us : +1-945-209-7691
Understand how Core Web Vitals, Next.js optimization, and performance-driven architecture influence your Google rankings and digital growth. Discover actionable steps and insights from Moltech’s SEO experts.
Enhance search visibility through Core Web Vitals and site performance improvements.
Leverage Next.js for faster rendering, caching, and user-centric experiences.
Turn page speed and SEO optimization into higher conversions and engagement.
Loading content...
Let's discuss your project and create a custom web application that drives your business forward. Get started with a free consultation today.


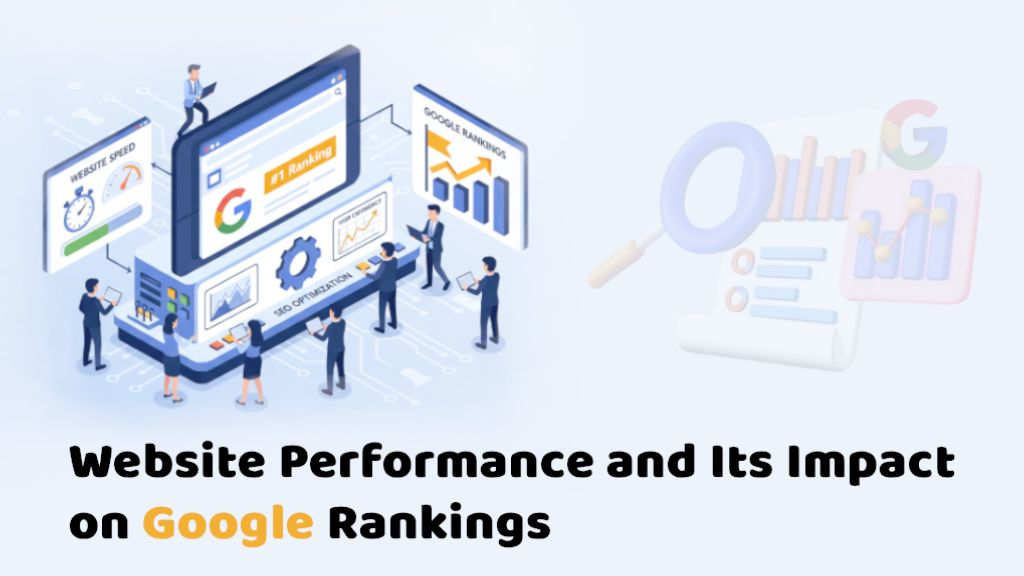
Visitors and Google both notice when your website is even a little slow. Site speed and responsiveness are no longer "nice to have" in today's environment, where attention spans are measured in seconds. They have a direct impact on how visible your site is in search engines, how many people buy from you, and how much it costs to get new customers.
This article talks about how Google uses Core Web Vitals to measure speed and interaction, why sluggish sites drop in ranks, and things you can do right now to make your site faster. You'll get a hands-on optimization checklist with lazy loading, CDN, and caching, as well as Next.js samples and information on how Moltech helps clients turn speed improvements into measurable SEO and income increases.
We keep the vocabulary to a minimum and the value high so that digital marketers, developers, and business owners can all agree on what matters most: fast loading, instant feeling, and higher rankings.
The solution to the question of how Google decides if your site is quick or annoying is Core Web Vitals (CWV). These are real-world performance indicators from people who use Chrome — not just tests in a lab. Google looks at how quickly real visitors view and use your site to decide how good it is.
Core Web Vitals are part of Google's broader Page Experience signals. They aren't the most important ranking factor (content quality still leads), but they can break a tie when two pages are equally relevant.
Visitors dislike slow or unstable sites, and that frustration can affect your business in several ways:
In short, speed builds trust — both from users and from search algorithms.
You don't have to guess; Google provides several tools that give you both real-user (field) and lab data:
Core Web Vitals turn everyday user frustrations — slow loading, layout shifts, laggy clicks — into measurable data points you can track and improve. Reaching “good” scores for LCP, CLS, and INP not only helps your site rank better but also keeps visitors engaged long enough to read, interact, and convert.
A slow website doesn't just frustrate people — it quietly kills traffic, trust, and sales. When pages lag, visitors start drifting away, Google crawls less, and your conversions take a dip before you even realize what's happening.
It's simple: nobody likes waiting. Every extra second your page takes to load means more people click away. On mobile, most users won't even give you three seconds. They just move on to something else that loads faster. You don't lose them because your content is bad — you lose them because it never had the chance to appear in time.
There's a clear connection between speed and sales. When your website feels snappy, visitors move naturally through it — they browse, add to cart, and check out. But if it hesitates or freezes halfway, they second-guess. Sometimes just improving load time by a few hundred milliseconds can lift conversions by noticeable margins. It's that sensitive.
Googlebot has a crawl budget — a kind of time limit on how many pages it can scan from your site. If your server takes forever to respond or relies heavily on JavaScript, Google might index fewer pages. That slows down how quickly new blogs, products, or updates appear in search. Speed literally affects how visible your site is on the web.
Your website is your store.
That's exactly what's happening digitally when your LCP, CLS, or INP scores fall short. Every delay or jump on the screen represents a person who almost converted… but didn't.
Speed doesn't just make your site look good — it builds trust. Fast pages make users feel confident; slow ones make them question reliability. And Google sees that same pattern in your analytics. So fixing performance isn't only about rankings — it's about keeping real people from walking out of your digital door.
When you talk about SEO, performance isn't something extra — it's part of the foundation. A fast site isn't just good for visitors; it helps Google understand and crawl your content faster. If the page loads smoothly for humans, it usually loads smoothly for crawlers too.
Let's walk through a few technical areas that make the biggest difference.
If your server takes forever to reply, everyone — people and Googlebot — ends up waiting. That initial delay is called Time to First Byte (TTFB), and it's often the first sign your hosting setup needs attention. Things like slow databases, missing caching, or overloaded servers are common culprits. Upgrading hosting, adding a caching layer, or using a CDN can make a world of difference. In plain terms: the quicker your server says “hello,” the quicker Google can start reading your page.
We all love fancy frontends, but too much JavaScript can quietly hurt your visibility. If your site needs to load dozens of scripts before showing real content, Google might miss what's important. Try rendering key elements on the server side, and split large JS bundles so the browser loads only what it needs at first. Lighter pages not only feel faster but are easier for crawlers to process — a win on both fronts.
Browsers are smart enough to follow your hints — you just have to give them some. Use preconnect, preload, or priority hints to tell the browser what matters most. Fonts, hero images, and key scripts can start downloading early instead of waiting in line. It's a tiny tweak that often shaves seconds off the first visible paint, especially for users on slower connections.
Few things feel worse than staring at a blank white screen while the page “thinks.” That happens when CSS or JavaScript blocks rendering. Inline the critical CSS — the stuff needed to show the top of the page — and let the rest load later. Defer non-essential JS until after the first paint. It doesn't just look faster; it is faster, because users can start scrolling or reading right away.
Google rewards sites that load quickly, display clearly, and waste fewer resources. Clean code, solid caching, and smart rendering help both people and crawlers do what they came for — without waiting around.
These are the three things you should focus on this quarter:
Only load images, videos, and components that are below the fold when they are about to enter the viewport.
Serve static and cacheable information from servers that are closer to your users. Push assets to the edge to cut down on latency.
At every level, cache as much as you can.
Use Brotli compression and connections that stay open.
Focus on the biggest files (like graphics and JavaScript) and the longest delays (like server response and third-party scripts). Add CDN and caching to get long-lasting performance improvements across your whole site.
Next.js provides a modern toolbox for performance: file-system routing, server-side rendering, React Server Components, and built-in image/font optimizations. Here's how to turn those features into measurable speed gains.
next/imagenext/image handles automatic resizing, modern formats, lazy loading, and priority hints to improve LCP and overall performance.
Example:
1
2
3
4
5
6
7
8
9
10
11
12
13
14
15
16
17
import Image from 'next/image';

export default function Hero() {
  return (
    <div>
      <Image
        src="/hero.jpg"
        alt="Hero Image"
        fill
        priority
        sizes="(max-width: 768px) 100vw, 1200px"
        placeholder="blur"
        blurDataURL="data:image/svg+xml;base64,PHN2Zy8+"
      />
    </div>
  );
}dynamic()Split large components and load them only when needed to reduce initial load times.
1
2
3
4
5
6
7
8
9
10
import dynamic from 'next/dynamic';

const HeavyChart = dynamic(() => import('./HeavyChart'), {
  ssr: false,
  loading: () => <p>Loading chart…</p>,
});

export default function Dashboard() {
  return <HeavyChart />;
}next/scriptLoad analytics and marketing tags without blocking rendering to improve interactivity metrics like INP.
1
2
3
4
5
6
7
8
9
10
11
12
13
14
15
import Script from 'next/script';

export default function Page() {
  return (
    <>
      <Script
        src="https://example.com/tag.js"
        strategy="afterInteractive"
      />
      <Script id="consent-based" strategy="lazyOnload">
        {`/* Load secondary tags based on user consent */`}
      </Script>
    </>
  );
}Combine the speed of static pages with the freshness of dynamic content using Incremental Static Regeneration (ISR).
1
2
3
4
5
6
7
8
9
export const revalidate = 60; // seconds

export default async function BlogPage() {
  const posts = await fetch('https://api.example.com/posts', {
    next: { revalidate: 60 },
  }).then(res => res.json());

  return <Posts posts={posts} />;
}Move heavy data fetching and rendering to the server so the browser receives minimal JavaScript.
Benefit: Reduces JavaScript payloads, improves INP, and boosts overall responsiveness.
Use preconnect for external origins and preload critical fonts to avoid FOIT/FOUT (Flash of Invisible Text / Flash of Unstyled Text).
1
2
3
4
5
6
7
8
9
10
11
12
13
14
15
16
import Head from 'next/head';

export default function DocumentHead() {
  return (
    <Head>
      <link rel="preconnect" href="https://fonts.gstatic.com" crossOrigin="" />
      <link
        rel="preload"
        as="font"
        href="/fonts/Inter-var.woff2"
        type="font/woff2"
        crossOrigin="anonymous"
      />
    </Head>
  );
}Configure long-lived caching for static assets.
1
2
3
export default function middleware() {
  // Set headers at the CDN or via custom server configs
}Cache-Control: public, max-age=31536000, immutable) using your CDN or hosting platform.Use fetch with caching hints and deduplication in Next.js 13+ to reduce redundant network trips and stabilize LCP.
1
2
3
const data = await fetch('https://api.example.com/data', {
  next: { revalidate: 300 },
}).then(r => r.json());We don't think of performance as a vanity metric at Moltech; we think of it as a way to grow.
For engineers, making your website run better is more than just a box to check; it's a way to get ahead of the competition. Core Web Vitals make it clear that people want pages to load quickly, stay stable, and respond immediately away.
Begin with the basics, such caching, CDN, and slow loading. Then make the scripts that other people give you and the way rendering works better. With Next.js, you may use server components, ISR, next/image, and smart script loading. Find out how link speed affects sales by using Search Console and analytics.
Are you ready to use speed to grow your business?
Boost your website's performance, achieve higher search rankings, and convert more visitors into customers with Moltech's Performance Engineering, Technical SEO, and Next.js Development services.
Let's connect and discuss your project. We're here to help bring your vision to life!
